Last updated: Mar 2026
Workflows
Analytics
Posture trends across spend, utilization, connectors, governance, renewals, and portal adoption.
Where to find it
- In the app, go to Analytics.
- Most analytics screens support a Range selector (for example: 7d / 30d / 90d / 365d) and a Refresh button.
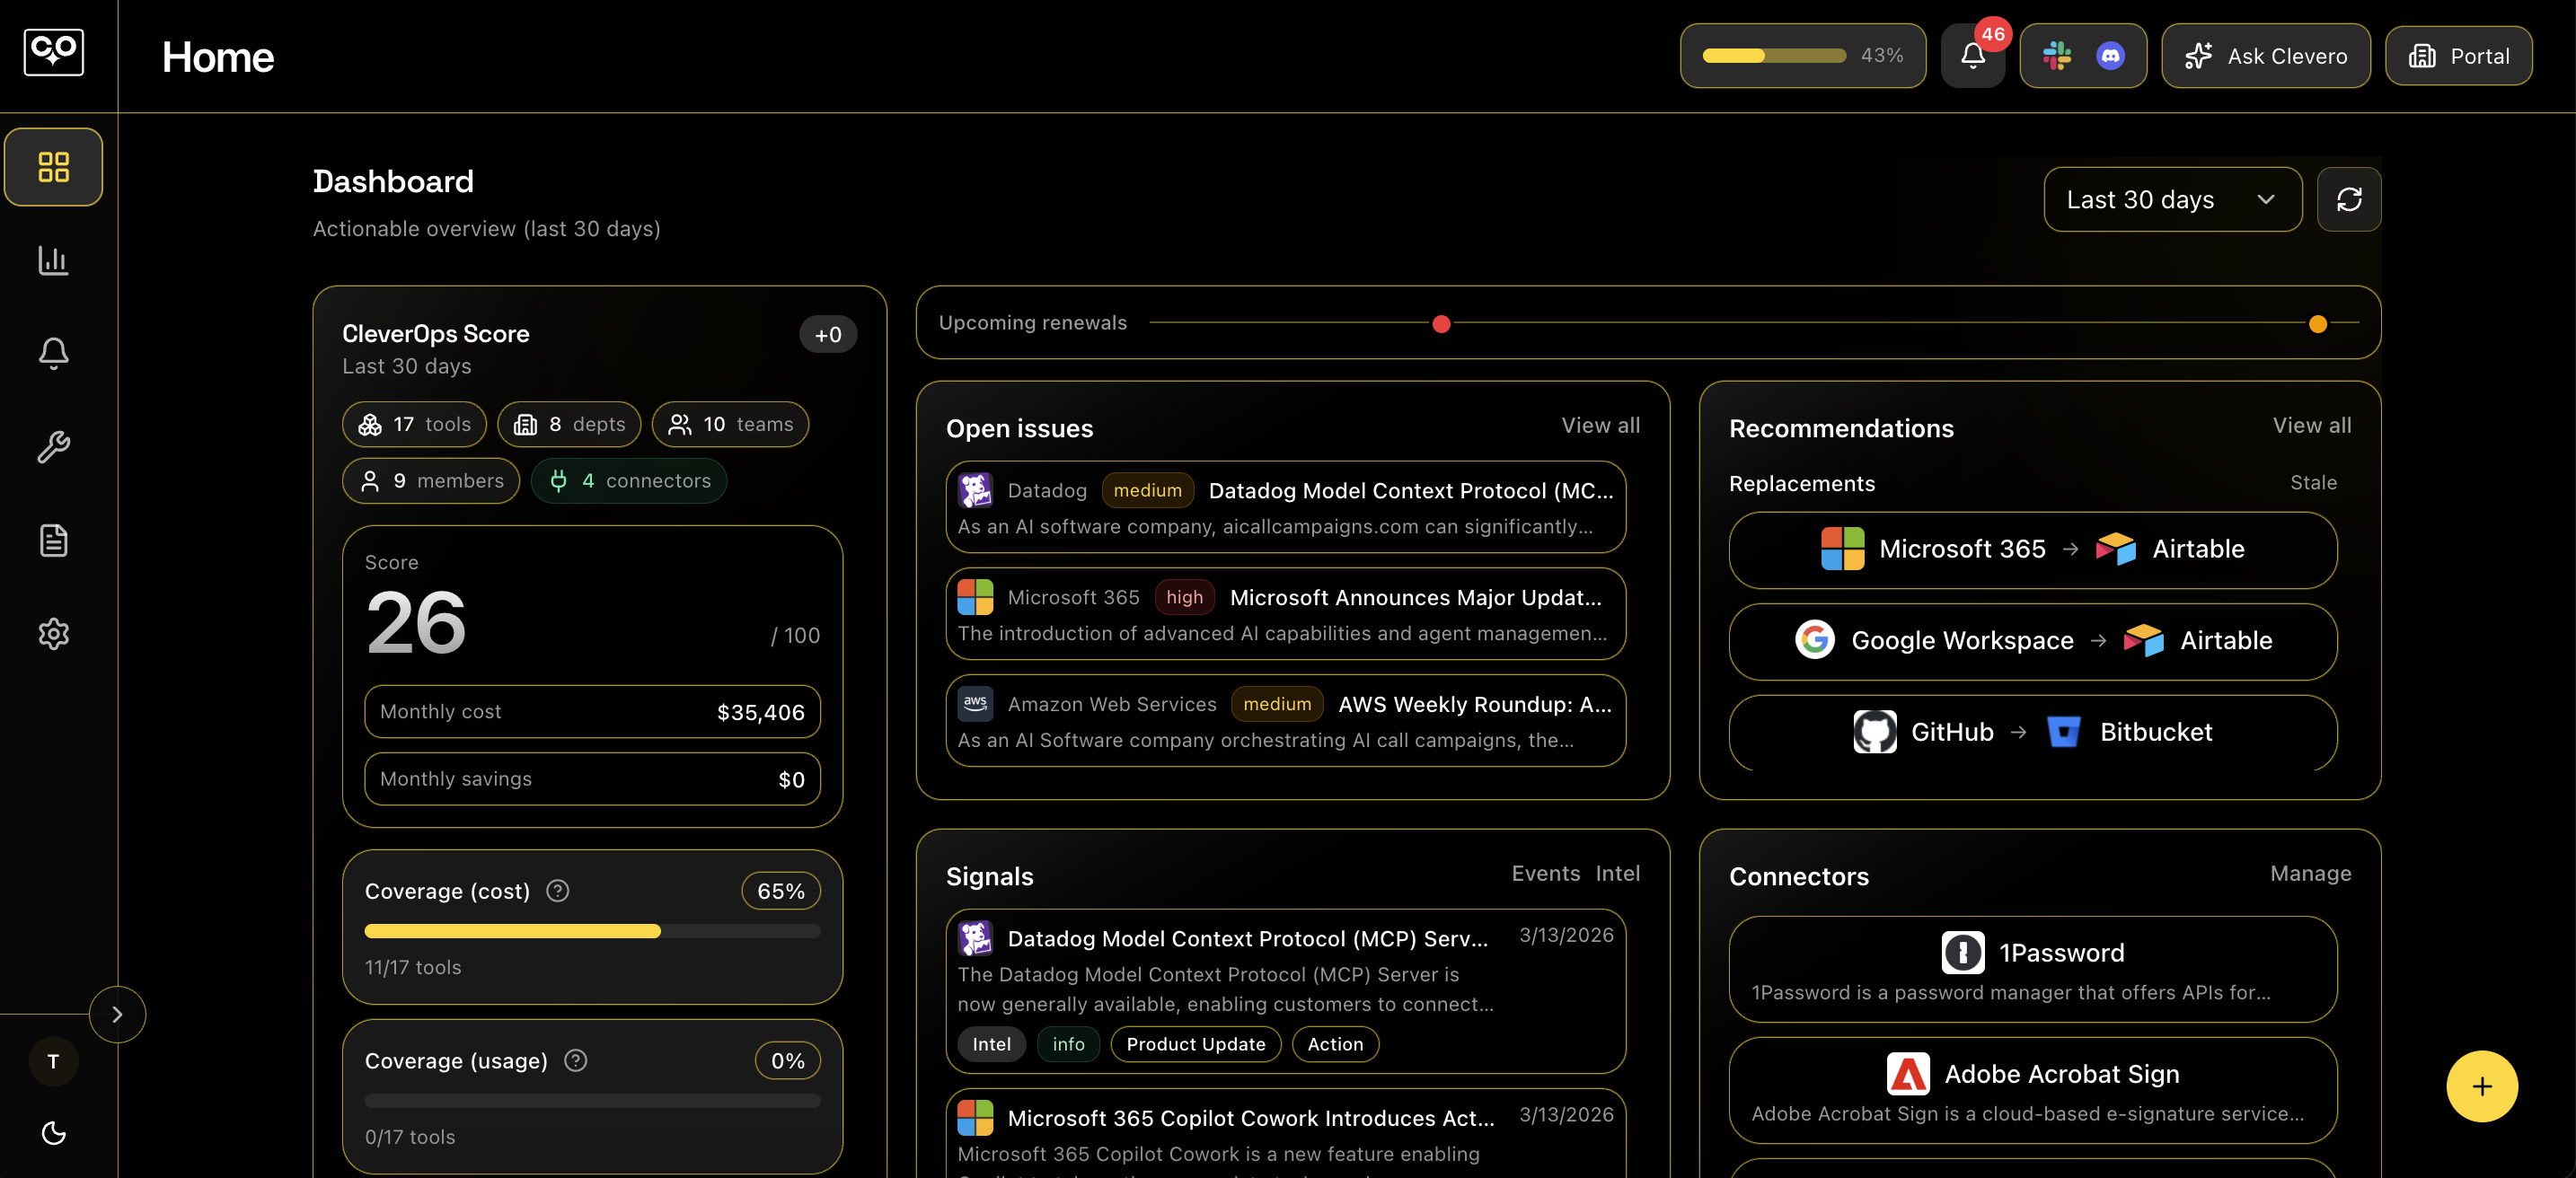
Overview
- KPI tiles for overall posture (total monthly cost, monthly savings, daily docs published, daily exports completed, and connectors active/error).
- A How to increase your score insights strip that rotates recommendations based on your current score drivers.
- Tabs for quick drill-down: Spend, Utilization, Connectors, Governance,Trends, and Raw.
Spend
- Breakdown and trends across key dimensions: tool, vendor, category, department, and team.
- Includes summary stats, trend charts, breakdown charts (bar/pie), and “movers” (biggest increases/decreases).
Utilization
- Seats and assigned users over time (with a trend chart).
- Tool picker lets you switch between All tools (aggregate) and a specific tool.
- Shows usage coverage (measured vs estimated) and highlights low-utilization and waste-by-cost tools.
Connectors
- Coverage over time and current connection health.
- Daily health chart can toggle between Coverage and Status modes.
- Includes a paginated daily table and a connection list with status badges (active / error / disabled / stale).
Governance
- Coverage and publishing activity trends over time.
- Dimension selector to view governance by tool, vendor, category, department, or team.
- Includes table views with pagination (coverage table, activity table) and an explicit refresh that can force a backend refresh.
Renewals
- Renewals calendar view with a month/week toggle and a selected-day drill-down.
- Highlights “delinquent” items and missing critical fields (like contract end dates / decision deadlines).
- Helps you prioritize upcoming renewals (for example: within 30 days).
Portal analytics
- Adoption and content readiness for the company portal.
- Shows member/invite breakdowns, library items by type, and portal activity over time.
- Includes external distribution health signals (access links, OTP requests and verification).